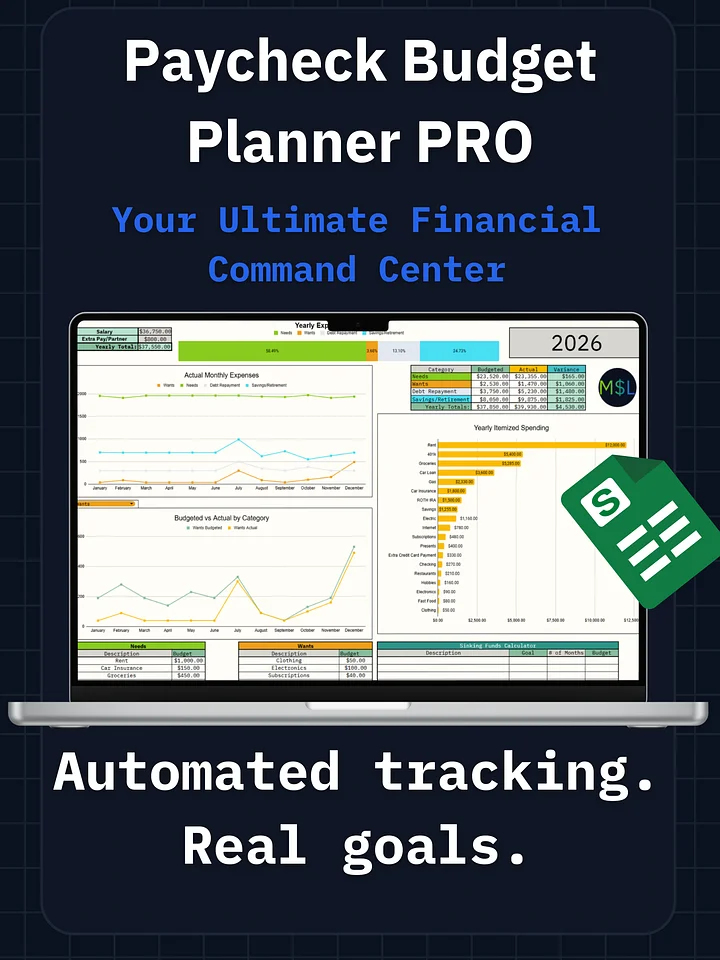
Monthly Grocery Budget Tracker Pro
See your month-to-month spending, what’s left, and your annual picture at a glance with upgraded dashboards and charts.
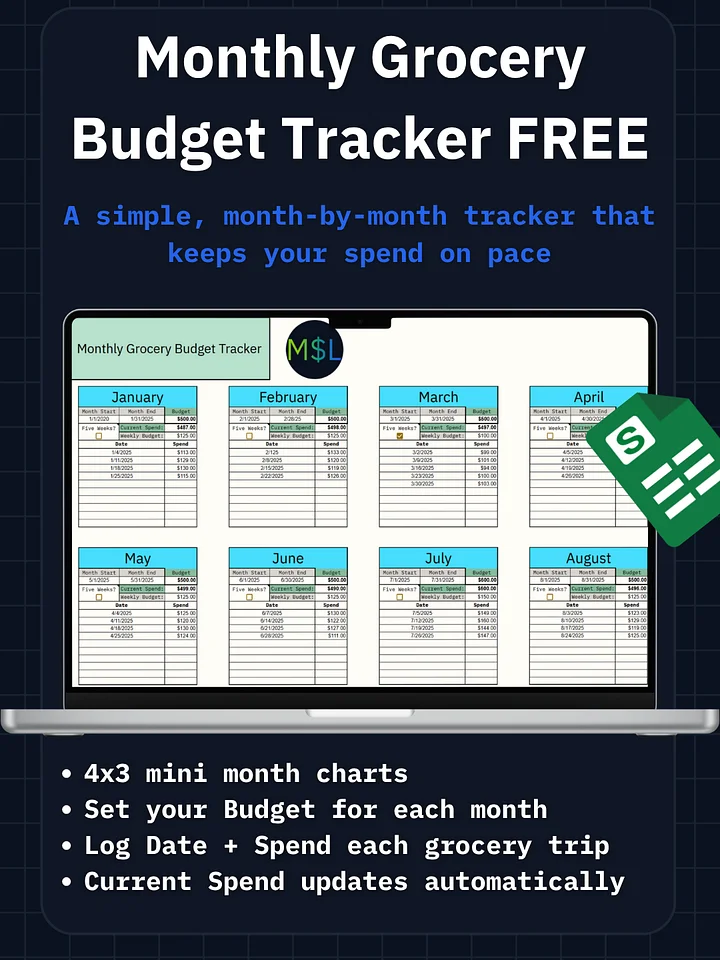
Turn weekly grocery trips into a clear plan for the whole year with 12 mini month charts—one for each month—so you can plan, log, and stay on track. Pro adds real-time Money Left, visual progress, and an annual dashboard so you can course-correct early and finish under budget.
What’s inside
-
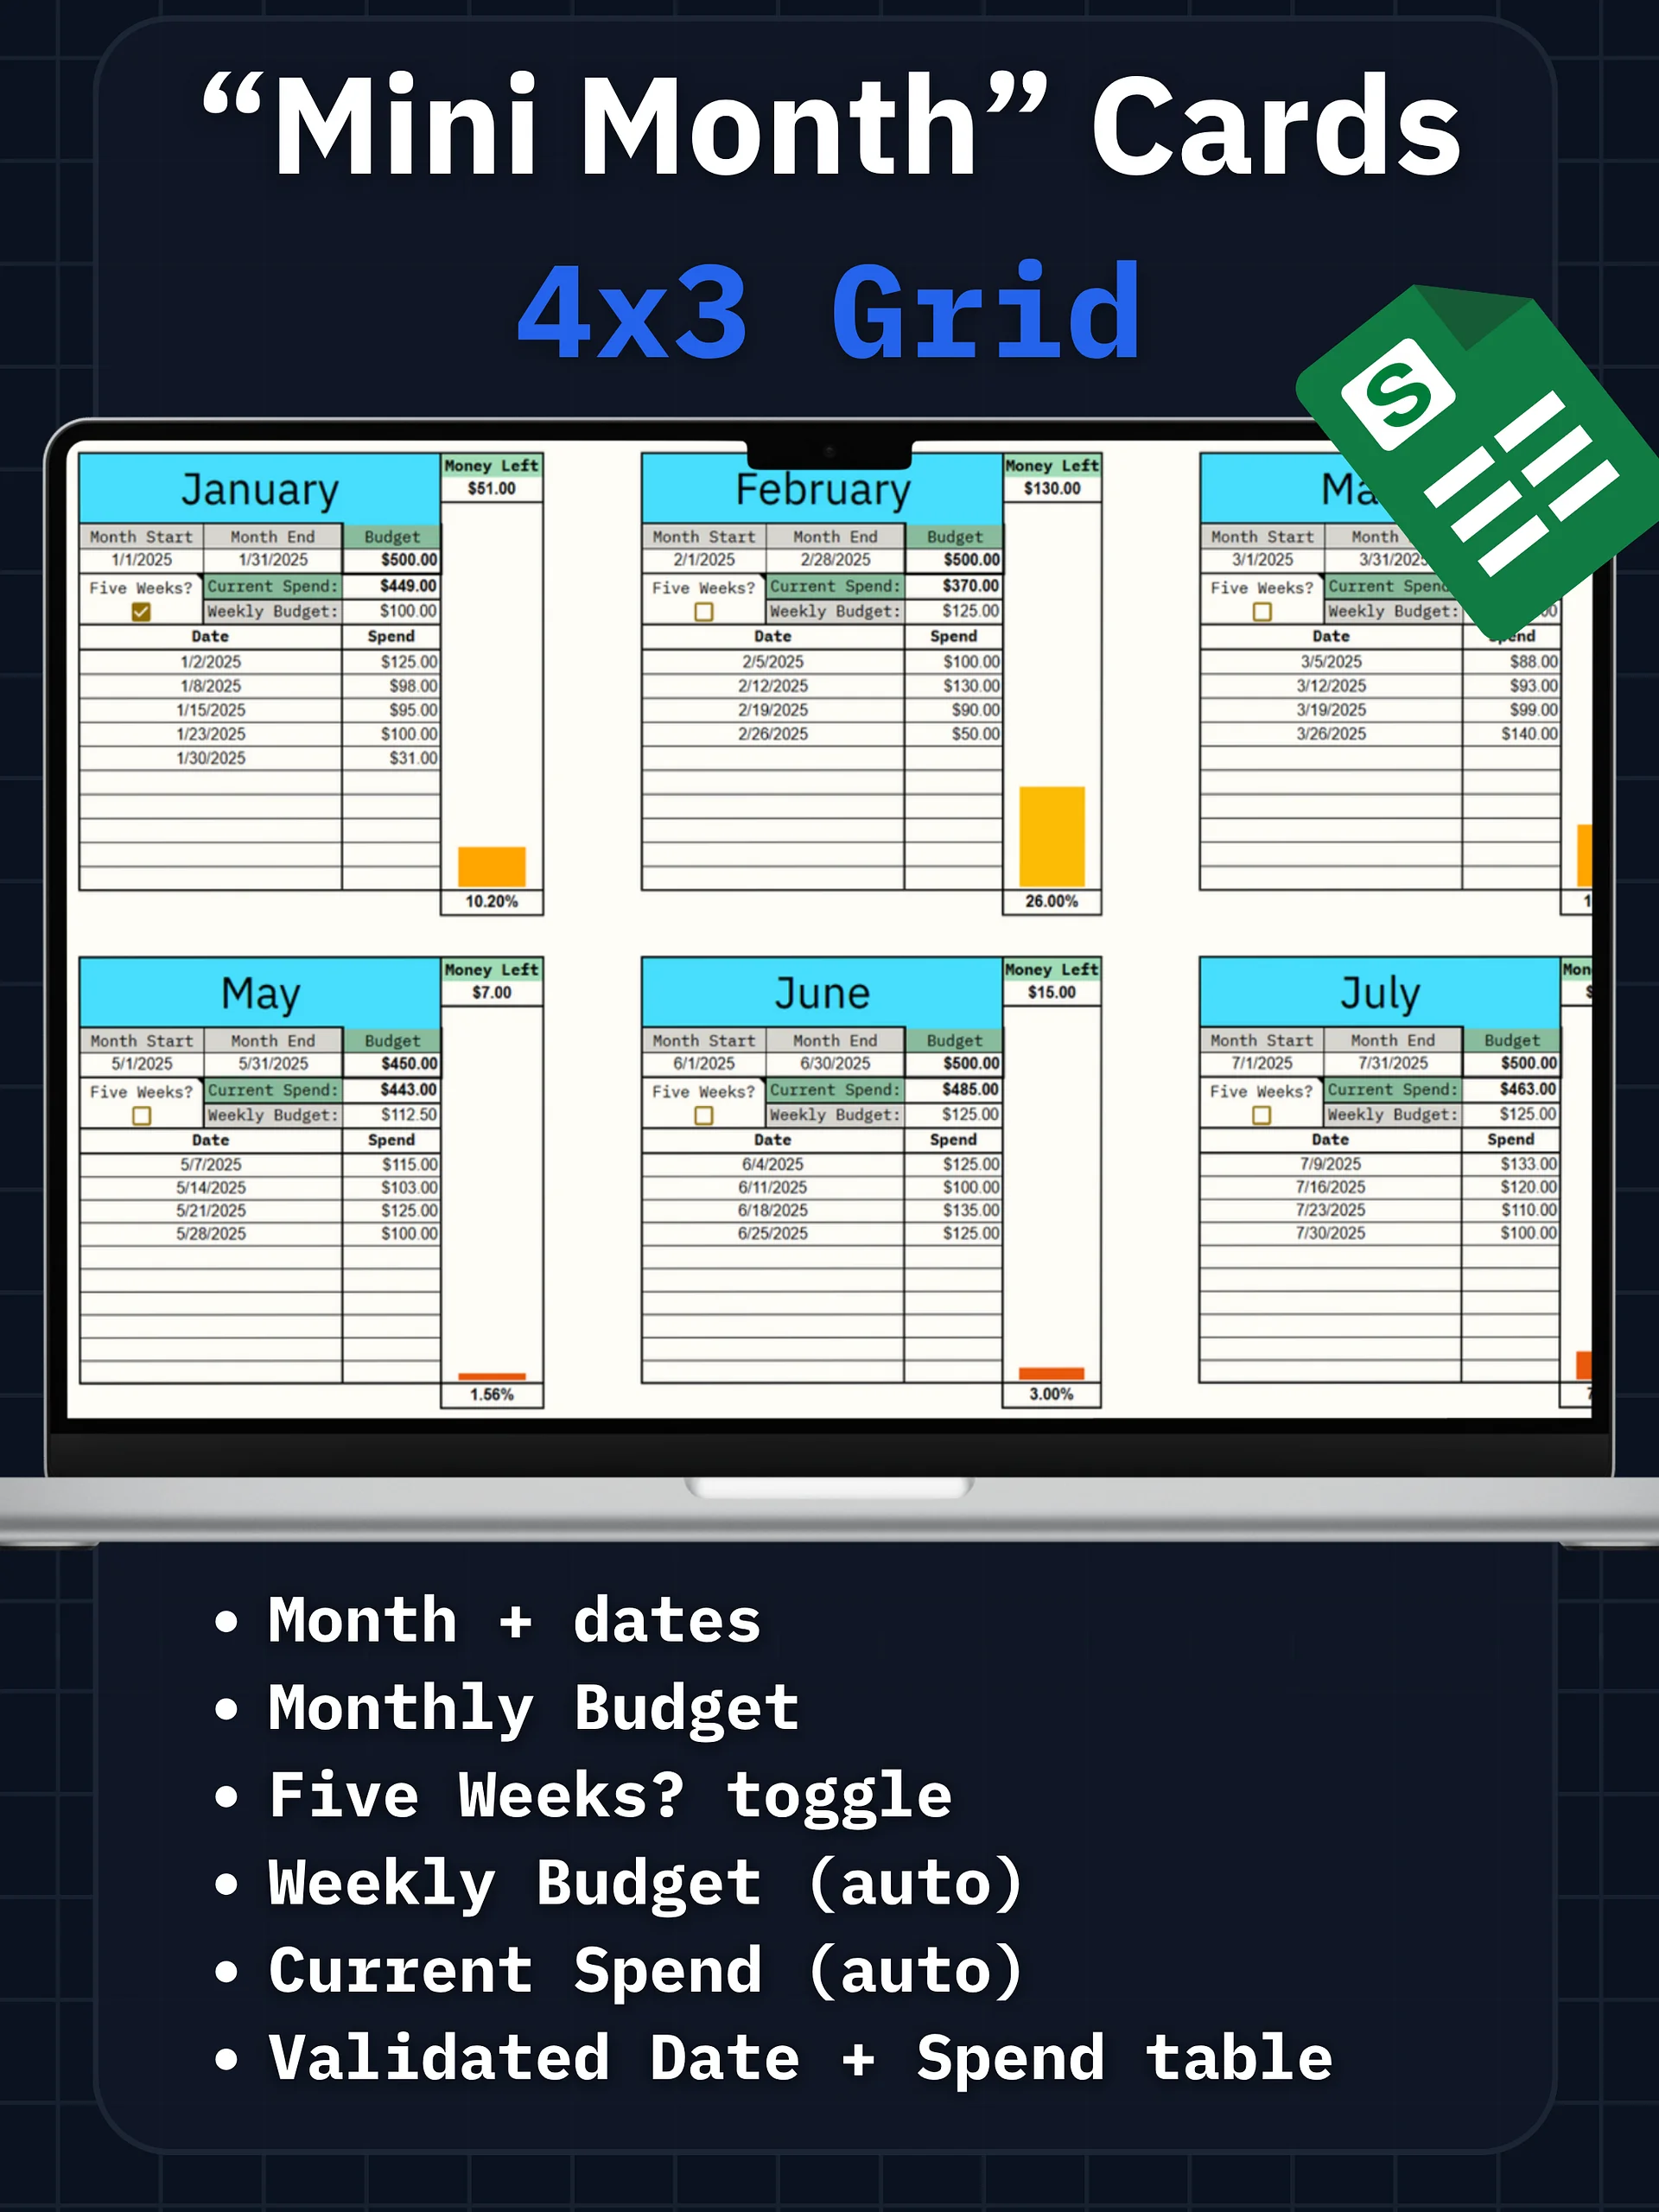
12 mini month charts (Jan–Dec)
-
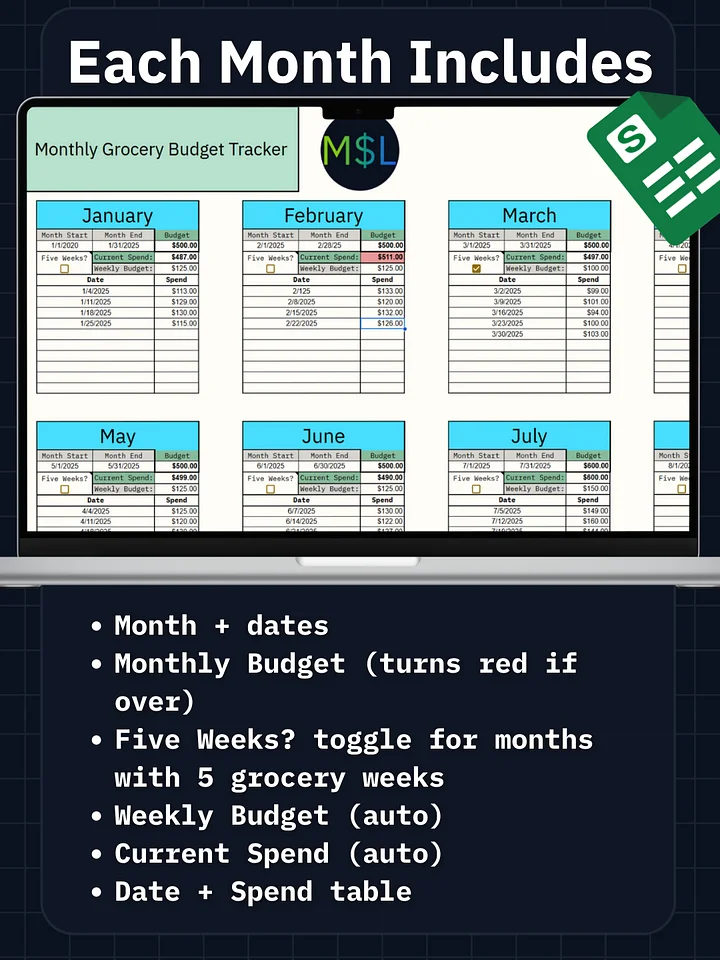
Top half (per month): Month name, Start/End dates, Monthly Budget, Five Weeks? checkbox, Weekly Budget (auto based on Monthly Budget + Five Weeks), Current Spend (auto)
-
Bottom half (per month): Date column with in-month validation + Spend column that auto-tallies into Current Spend
-
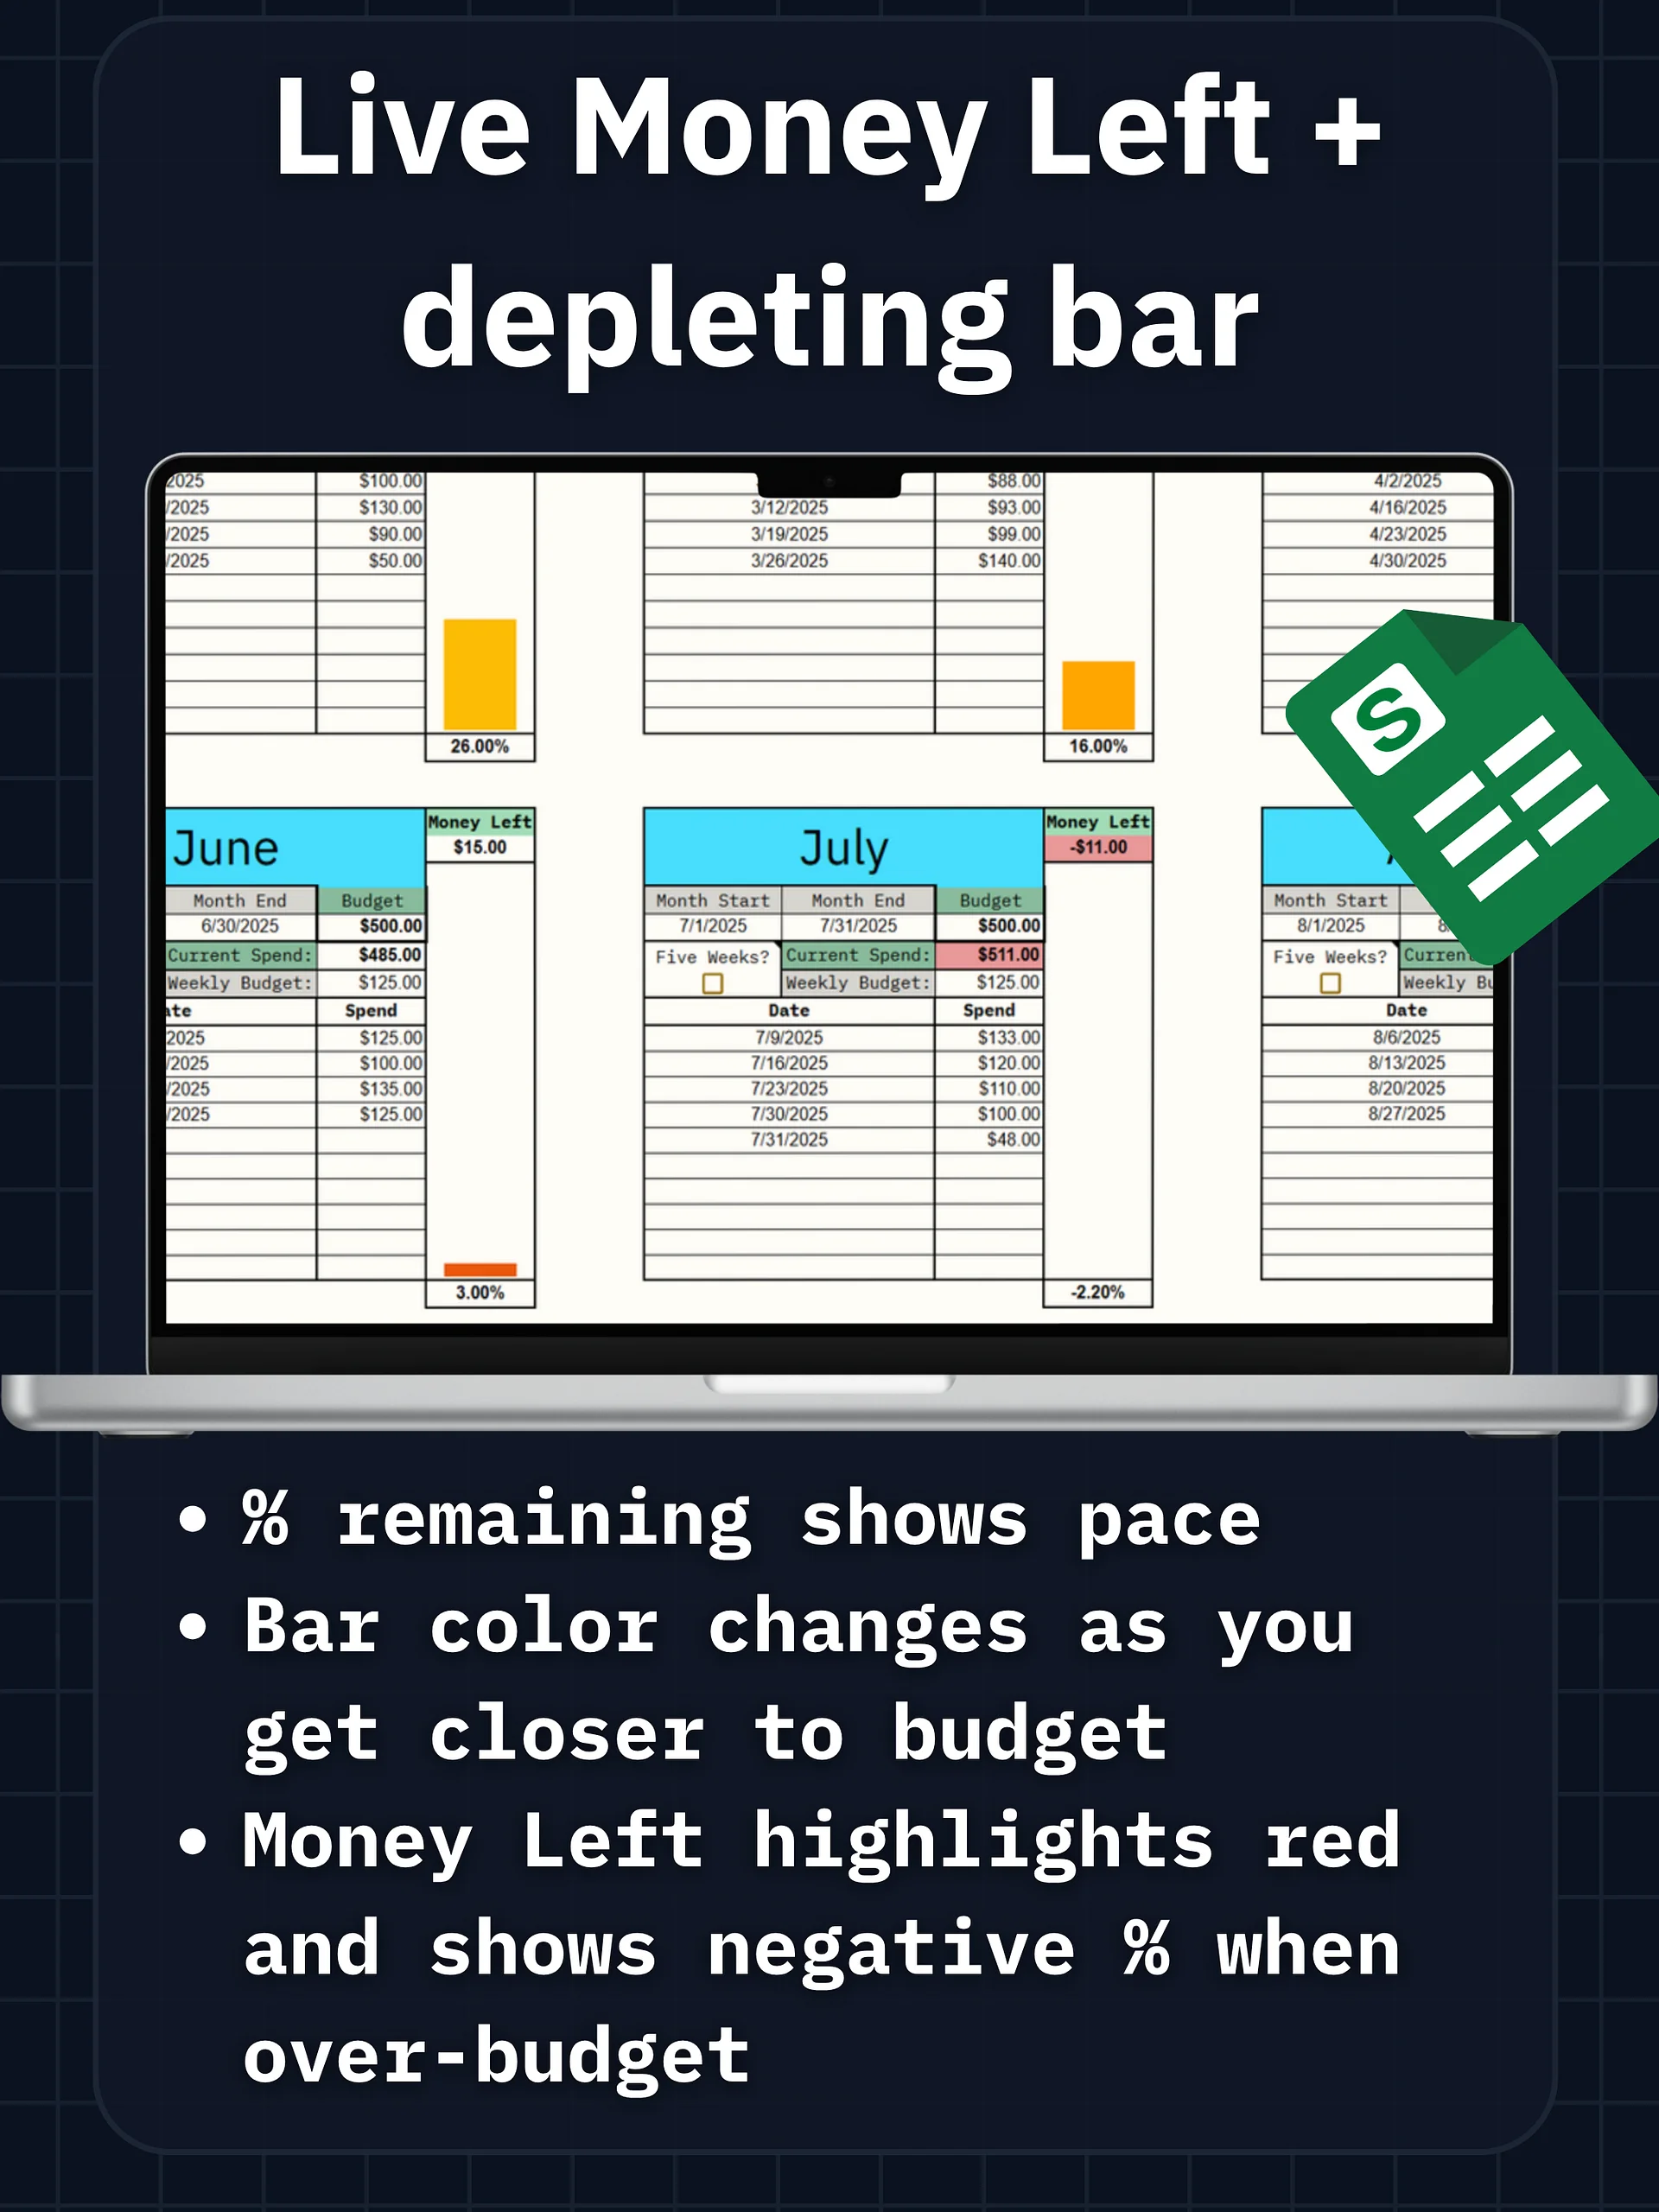
Money Left per month (auto)
-
Vertical progress bar that depletes as you spend
-
% remaining label (goes negative if over)
-
Section turns red when a month exceeds its budget
-
Dashboard (one tab):
-
-
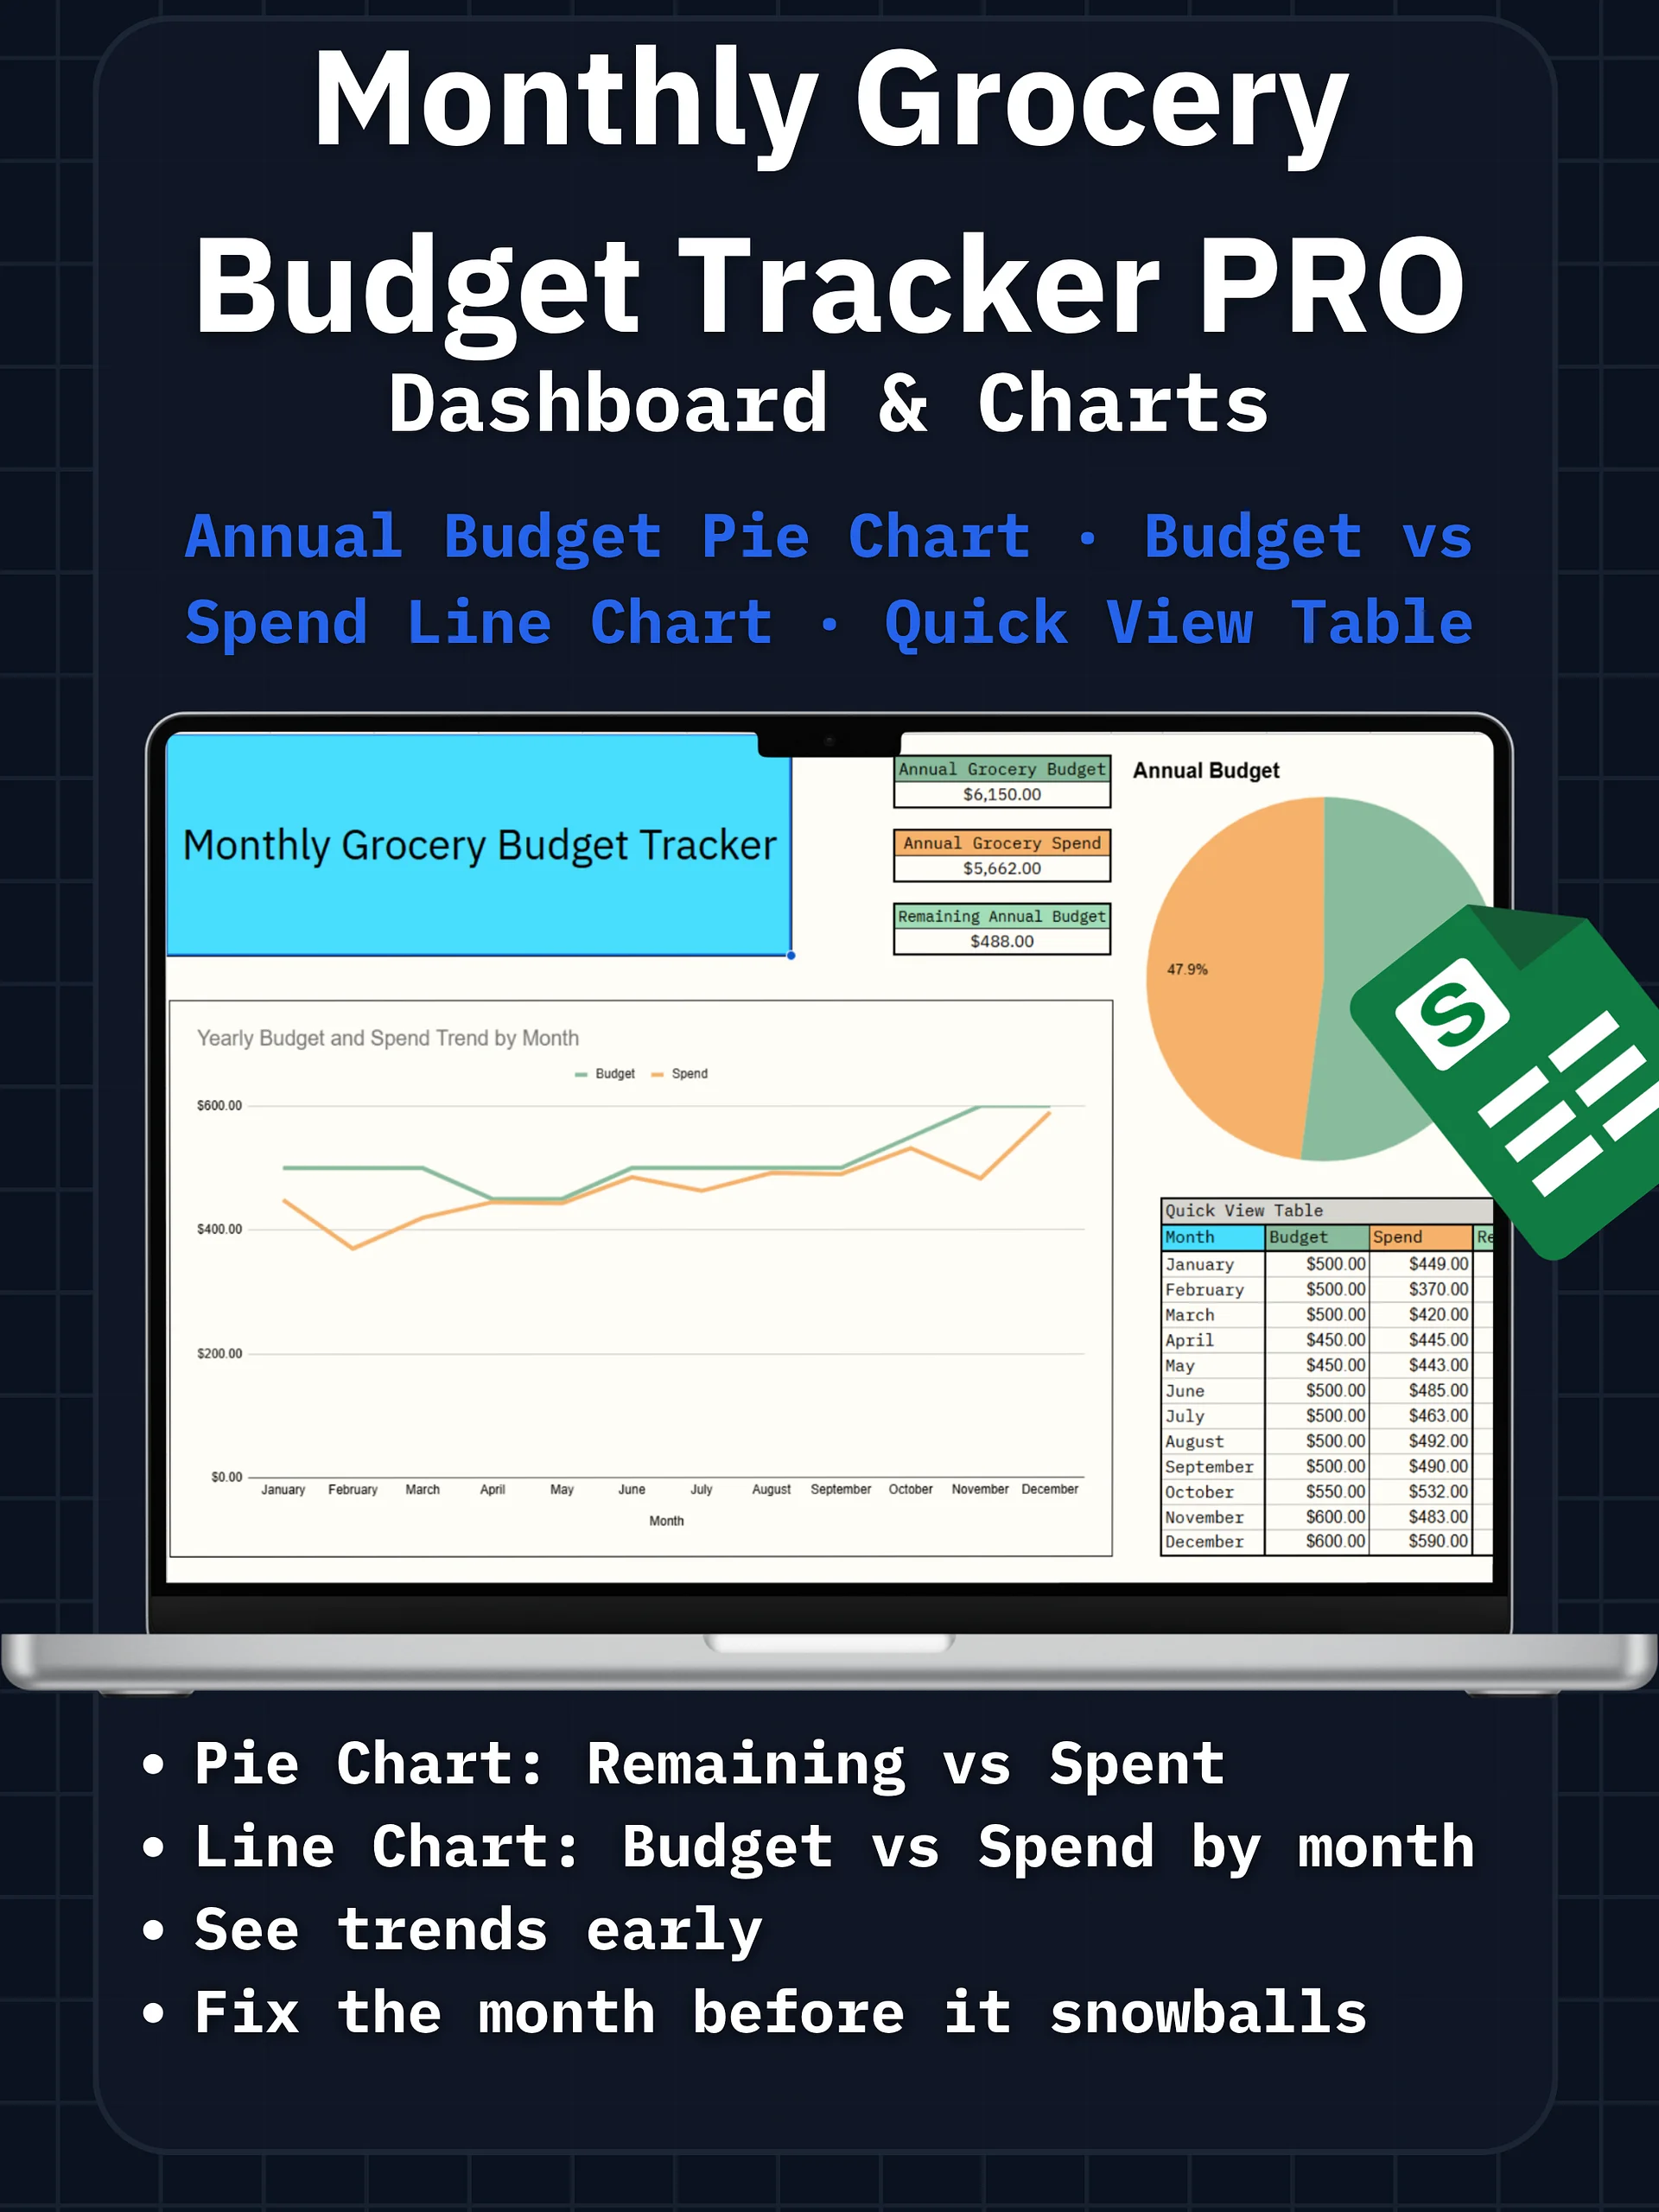
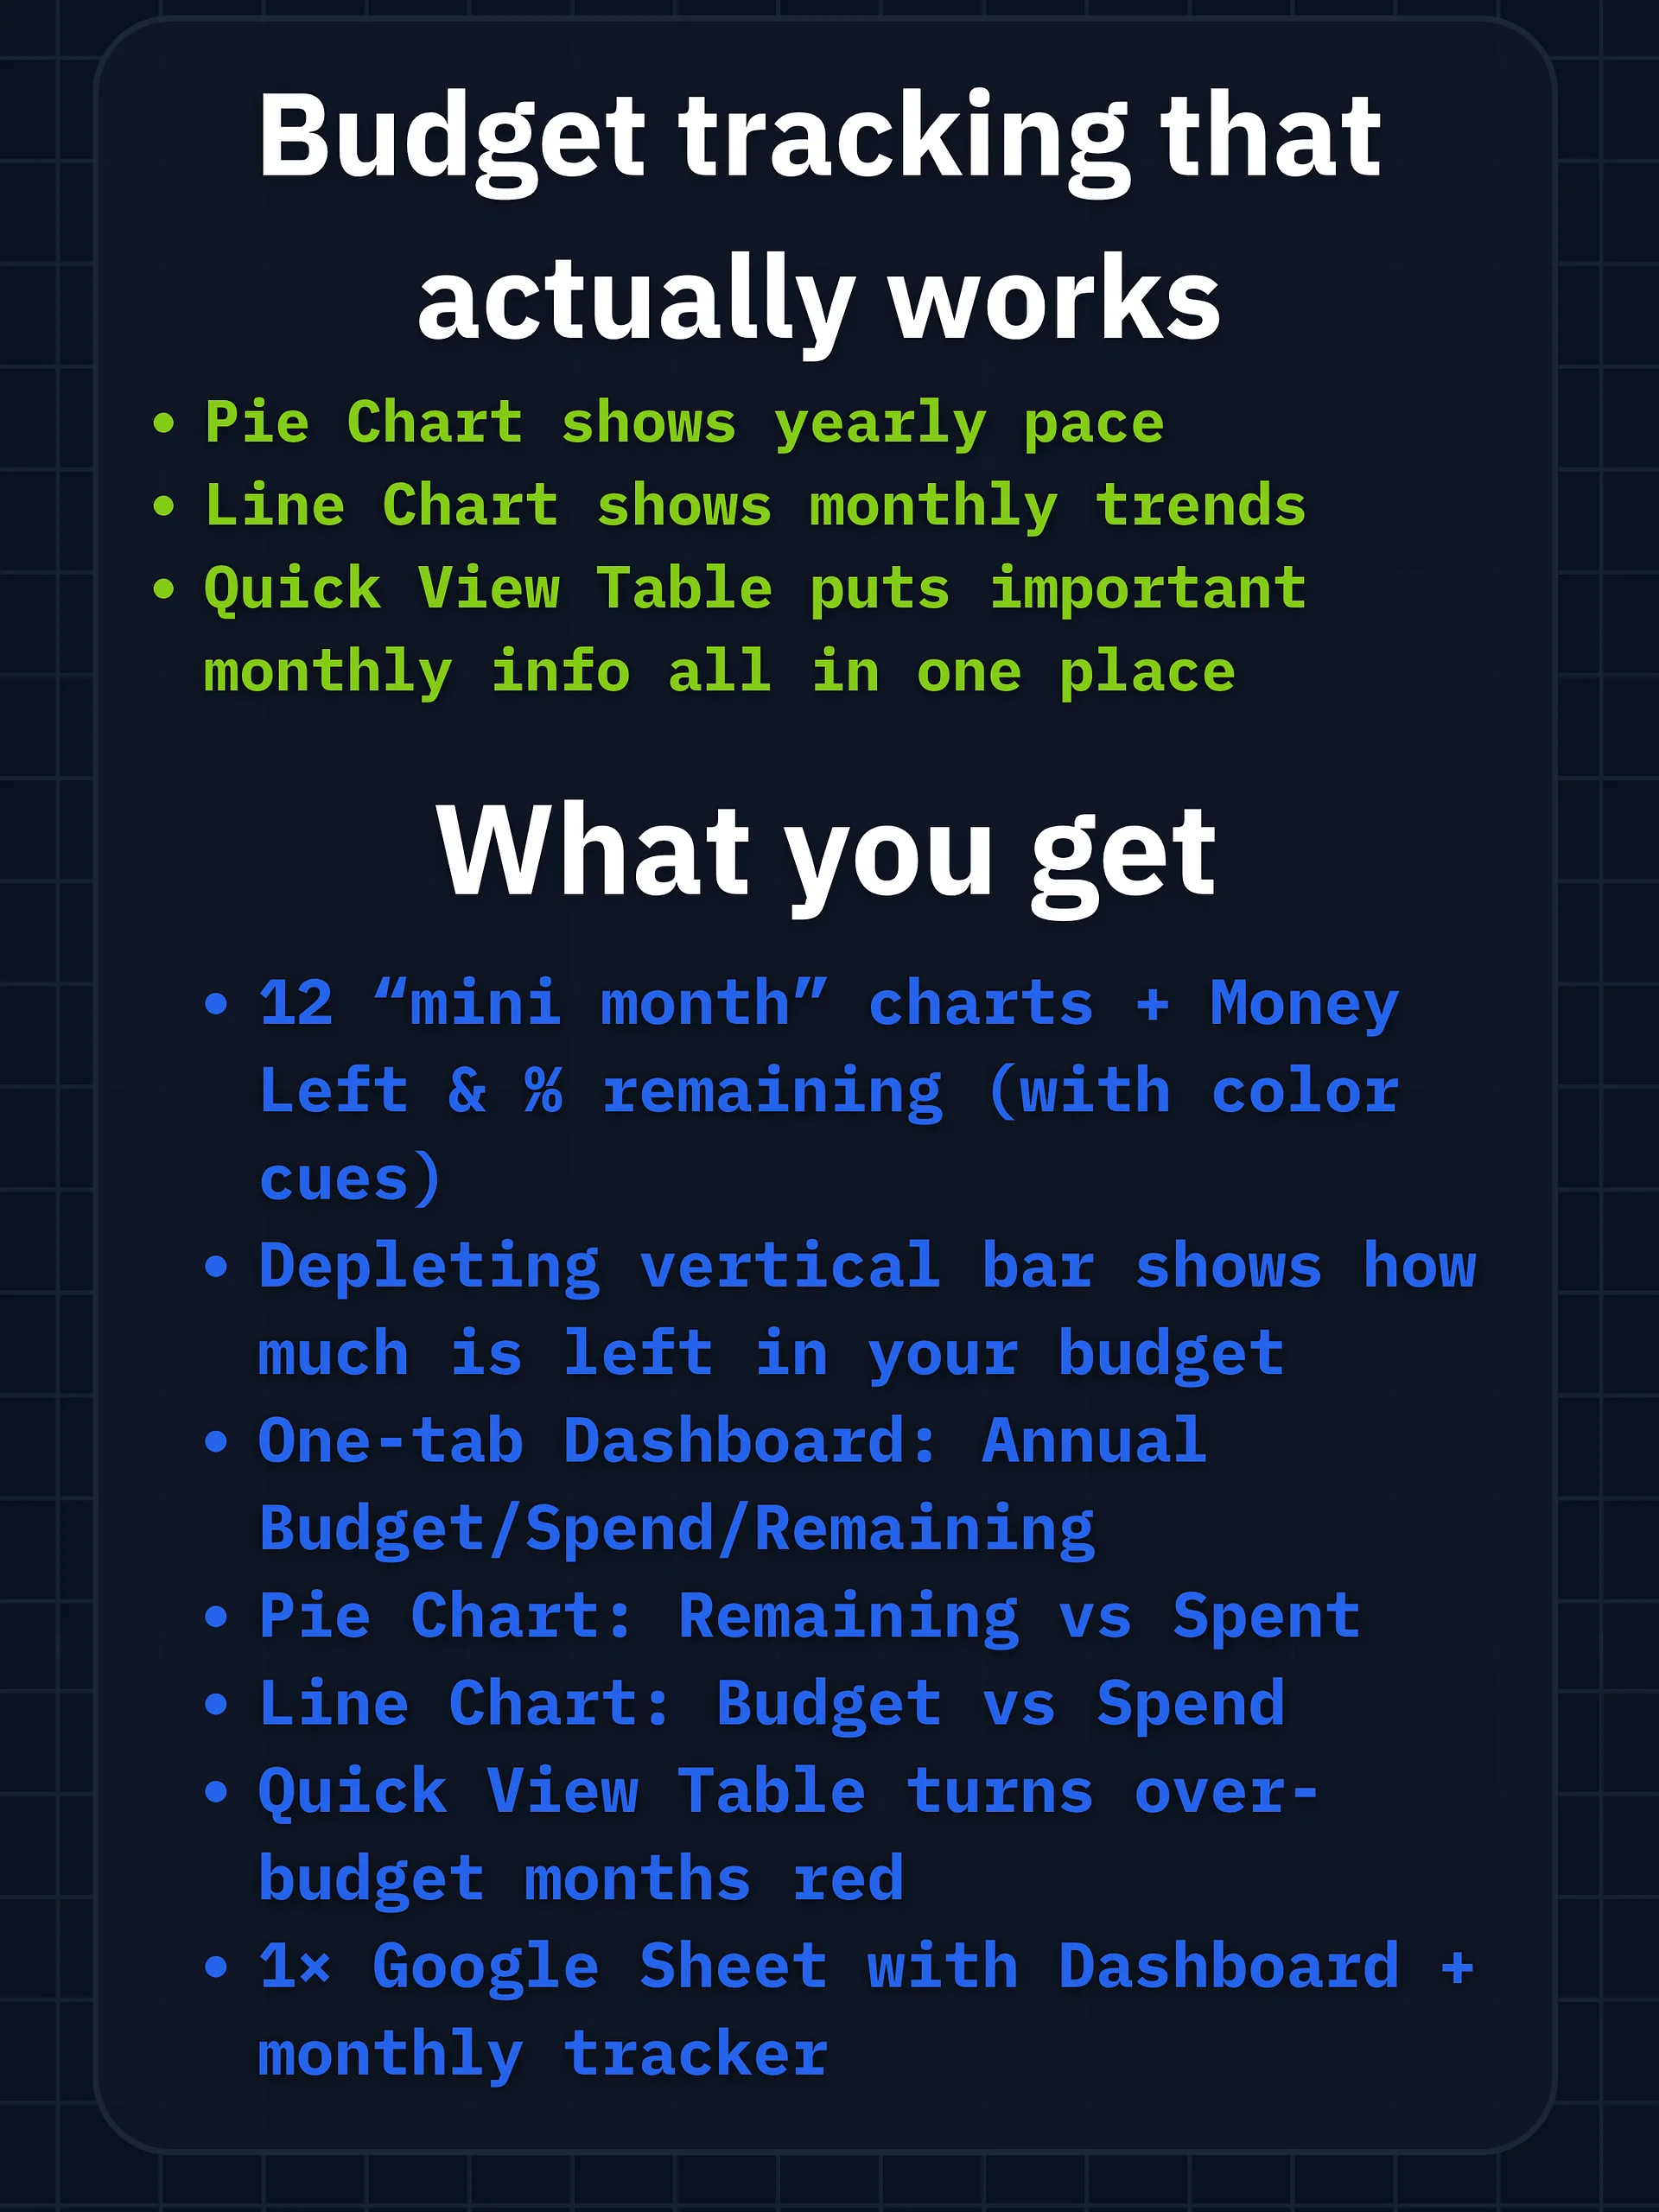
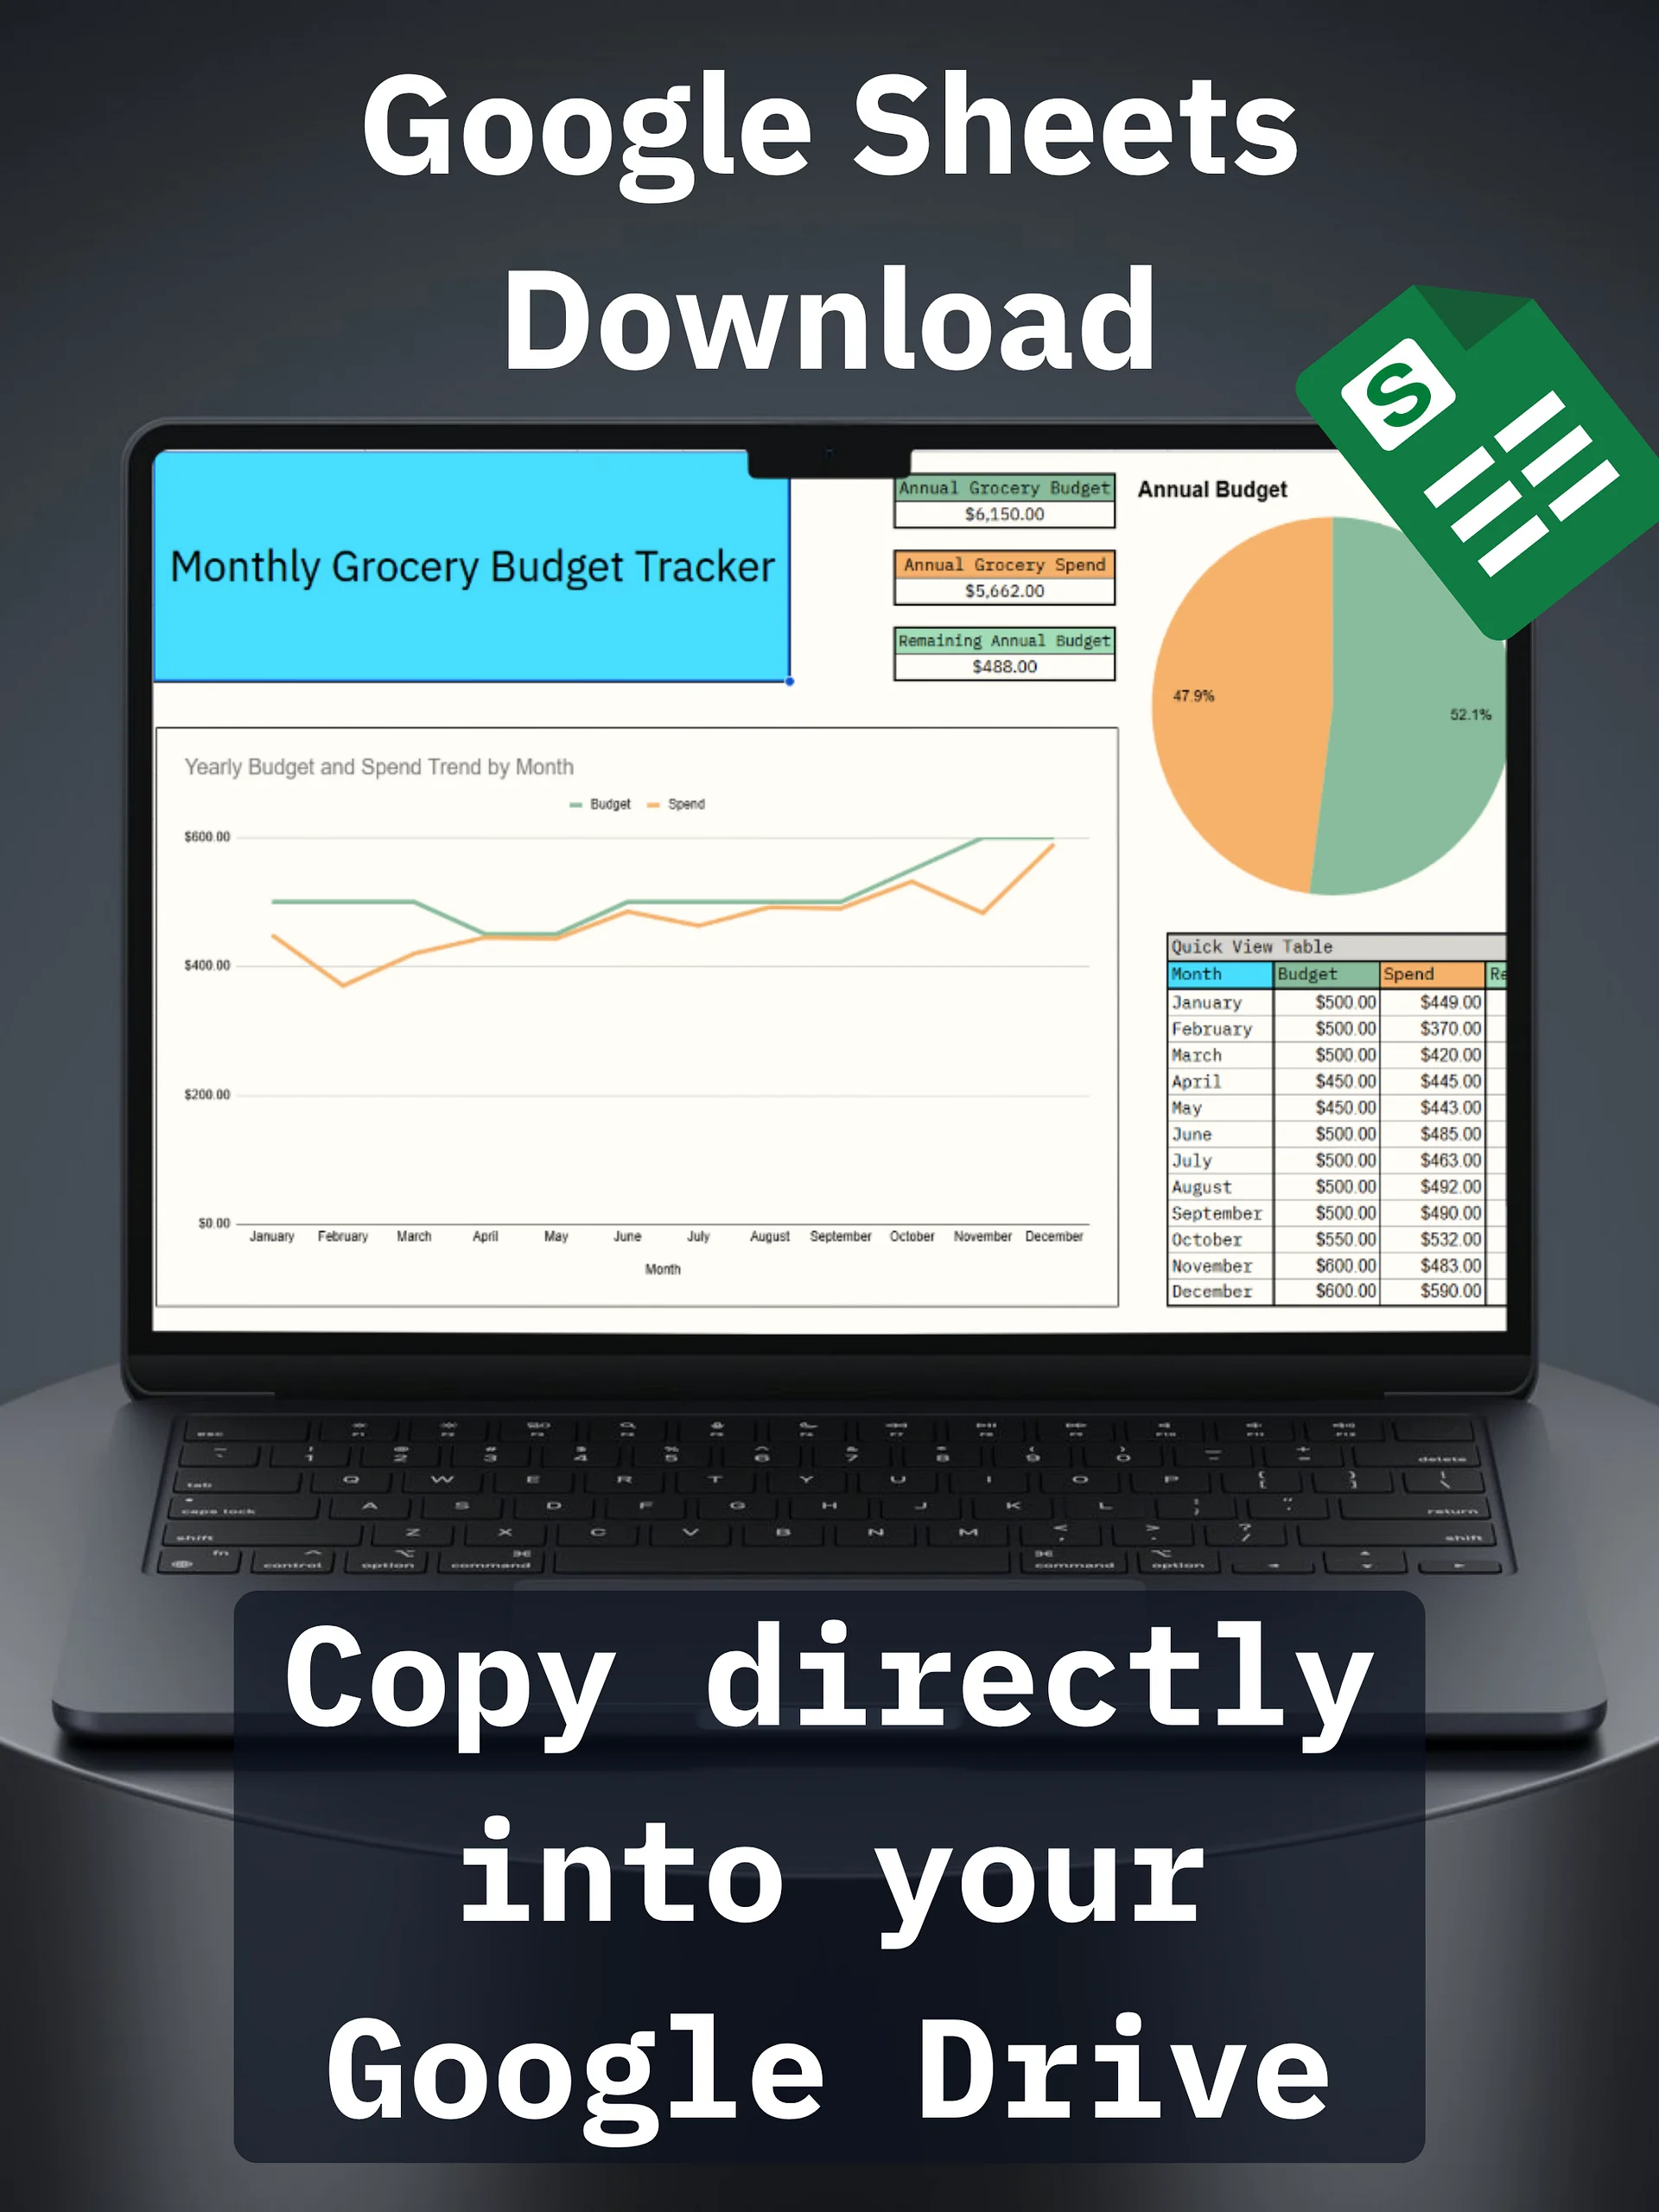
Annual Grocery Budget (sum of monthly budgets)
-
Annual Grocery Spend (sum of monthly spends)
-
Remaining Annual Budget
-
Pie chart: Annual Remaining vs Spent
-
Line chart: Monthly Budget vs Spend
-
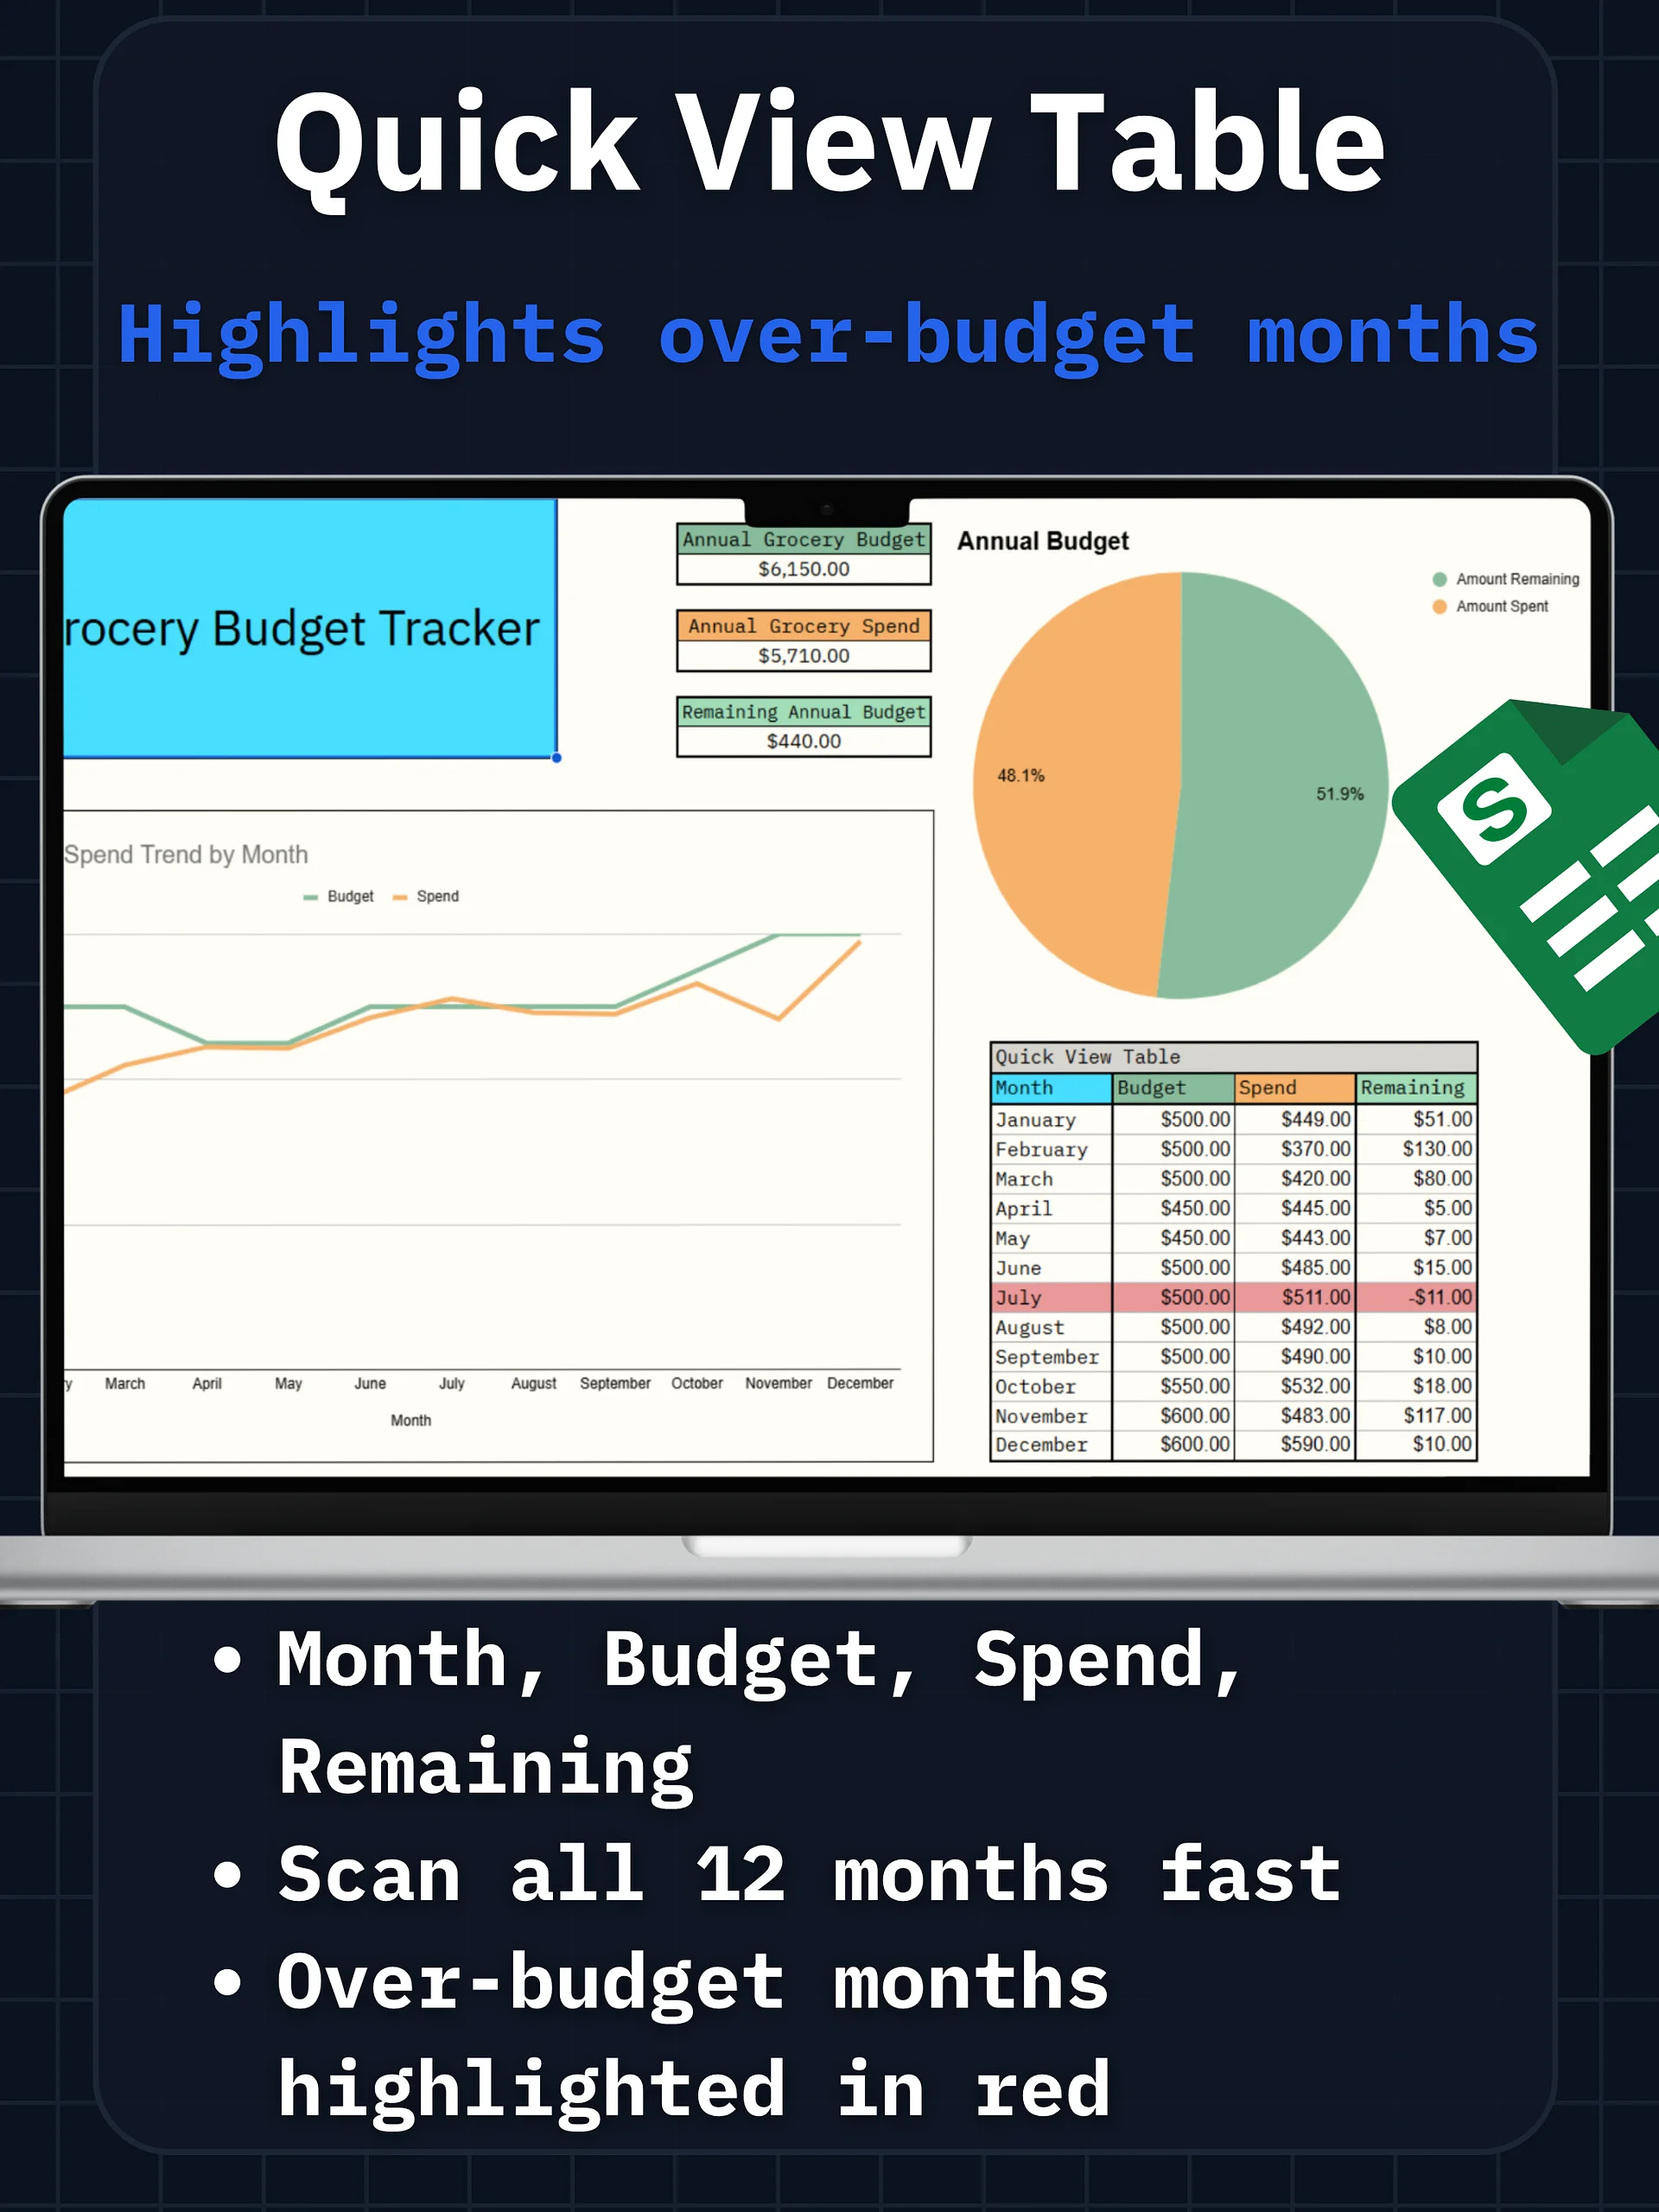
Quick View Table: Month / Budget / Spend / Remaining with row turns red if that month is over budget
-
How it works:
-
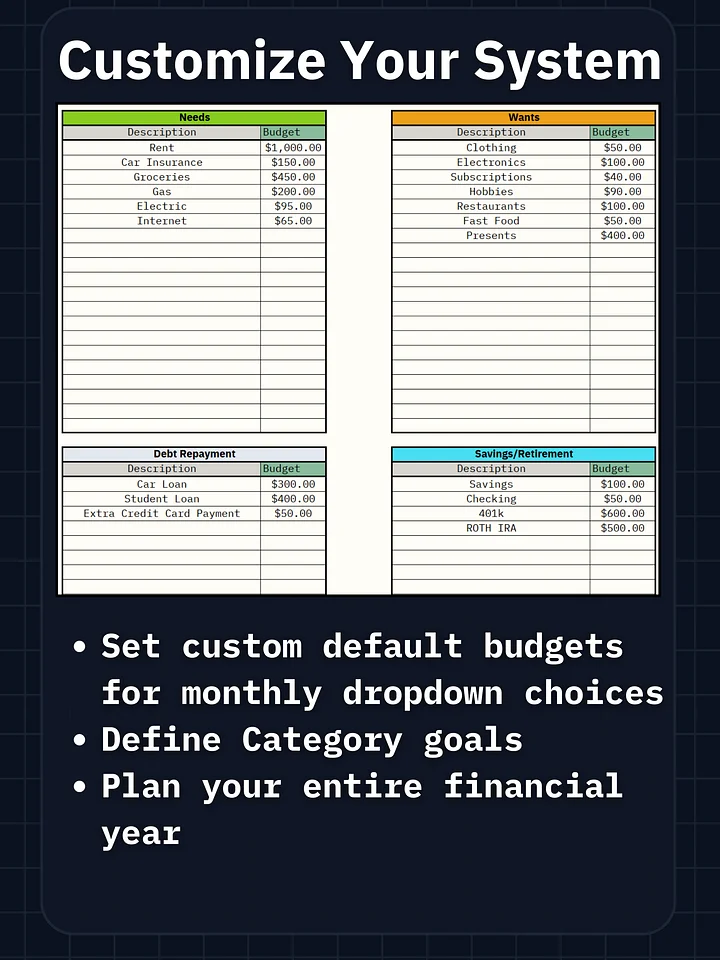
Set each Monthly Budget (or keep one baseline for all months).
-
Use Five Weeks? for months with 5 grocery weeks so your Weekly Budget is realistic.
-
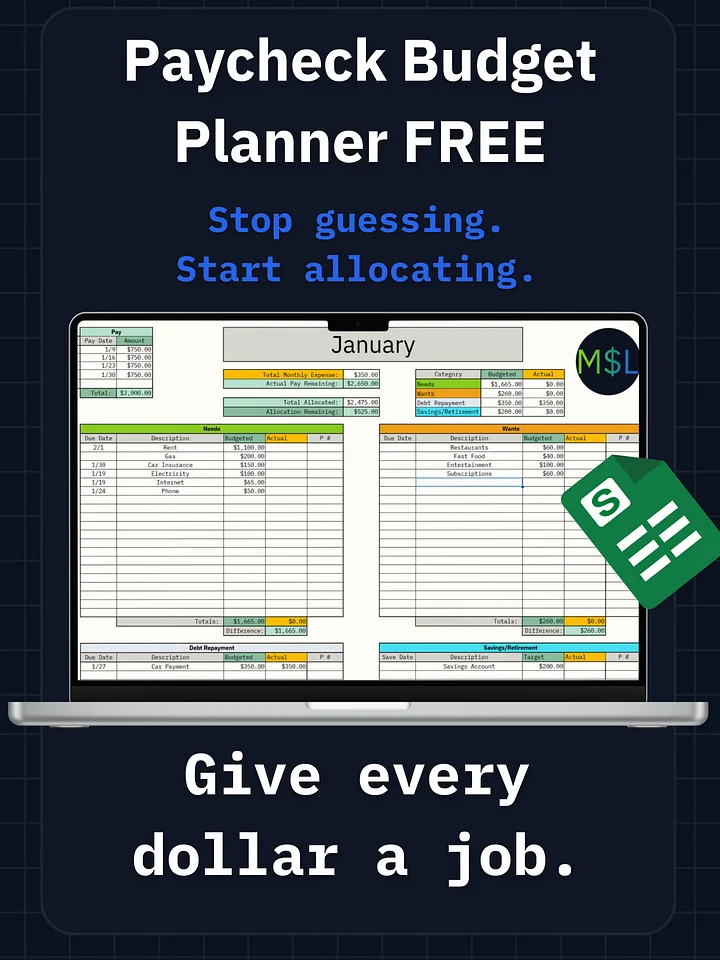
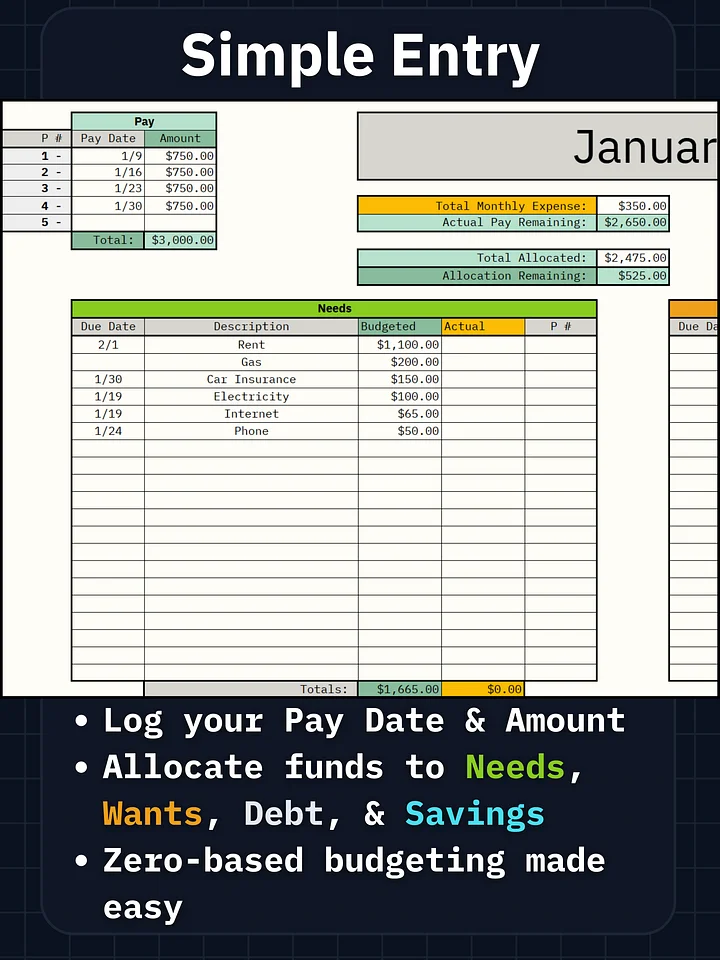
Log trips in Date/Spend - your Current Spend, Money Left, and % remaining update automatically.
-
Open the Dashboard to see your Annual Budget/Spend, trends, and which months need attention.
Why Pro works:
-
Visual feedback (bar + % remaining) keeps you on pace.
-
Annual view shows trends and prevents end-of-year surprises.
-
Quick View Table highlights over-budget months in red—fix it fast.
What you get:
-
1× Google Sheet (monthly tracker + Dashboard)
-
Quick start Read Me notes inside
FAQ
1. What’s different from the free version?
Pro adds Money Left, percent remaining, color changes as you spend, and an annual dashboard that shows budget vs. spend for the whole year.
2. How does the color change work?
As you spend, your “Money Left” bar moves from green → yellow → orange → dark orange. It only turns red if you actually go over budget.
3. What does the Dashboard show me?
It shows your total annual grocery budget, how much you’ve spent so far, how much is left, a pie chart (spent vs. remaining), and a monthly Budget vs. Spend line chart.
4. What is the Quick View Table for?
It lists every month with its budget, spend, and remaining. If a month goes over budget, that row turns red so you can spot it fast.
5. Can I change the monthly budgets later?
Yes. If you adjust a month’s budget, the dashboard totals update automatically.
Support:
If you need help accessing or using the sheet, reply to your order email and we’ll help.
Quality guarantee & returns
-
Tested for Quality: Every tracker is rigorously tested to ensure formulas are accurate and the experience is smooth.
-
Instant Digital Delivery: Because these are immediate digital downloads, all sales are final and non-refundable.
-
Personal Use Only: These files are for your personal financial system and are not for resale or redistribution.
-
We’ll Make It Right: If you have trouble accessing your file or find an issue, please contact us immediately. We are here to help you get your system running.